Introduction
Static maps are great, but interactive maps take spatial data visualization to the next level! Instead of just looking at a map, users can zoom, click, filter, and explore the data dynamically.
Python makes it easy to create interactive maps using libraries like Folium, Plotly, and Leaflet.js. Whether you’re mapping store locations, crime hotspots, or population trends, interactive maps provide a better user experience.
In this article, we’ll cover:
✅ Why interactive maps are useful
✅ The best tools for building them
✅ A step-by-step Python tutorial to create an interactive web map
1️⃣ Why Use Interactive Maps?
Unlike static maps, interactive maps allow users to:
✅ Zoom & Pan — Navigate through different locations.
✅ Click on Markers — Get additional information.
✅ Toggle Layers — View different datasets dynamically.
✅ Filter Data — Customize map views based on user preferences.
💡 Example: A real estate website lets users click on house icons to see property details (price, size, location).
2️⃣ Best Python Libraries for Interactive Mapping
🔹 Folium (Best for Web Maps)
- Built on Leaflet.js, one of the most popular web mapping frameworks.
- Simple Python interface for adding markers, popups, and heatmaps.
- Exports maps as HTML files for easy sharing.
🔹 Plotly (Best for Interactive Data Dashboards)
- Allows hover effects, filters, and 3D visualizations.
- Works well for business intelligence dashboards.
🔹 Geopandas + Shapely (Best for Vector Data Processing)
- Handles shapefiles, GeoJSON, and spatial joins before mapping.
💡 Example: A company can use Folium + Geopandas to map customer locations and identify sales trends by region.
3️⃣ Step-by-Step: Create an Interactive Map with Python (Folium)
🔹 Step 1: Install Folium
First, install Folium using pip:
pip install folium
🔹 Step 2: Create a Basic Interactive Map
Open a Python script and add:
import folium
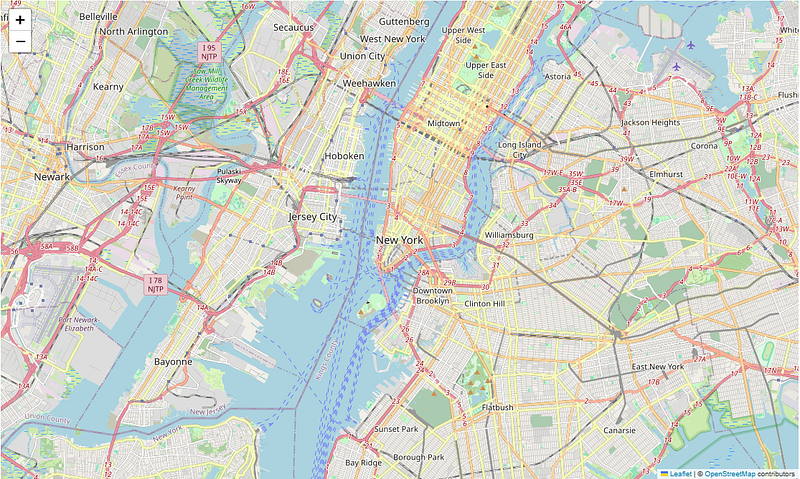
# Create a map centered on New York City
m = folium.Map(location=[40.7128, -74.0060], zoom_start=12)
# Show the map
m
# optional code
m.save("interactive_map.html")
print("Interactive map created successfully!")
✅ Output: A basic map centered on New York City!
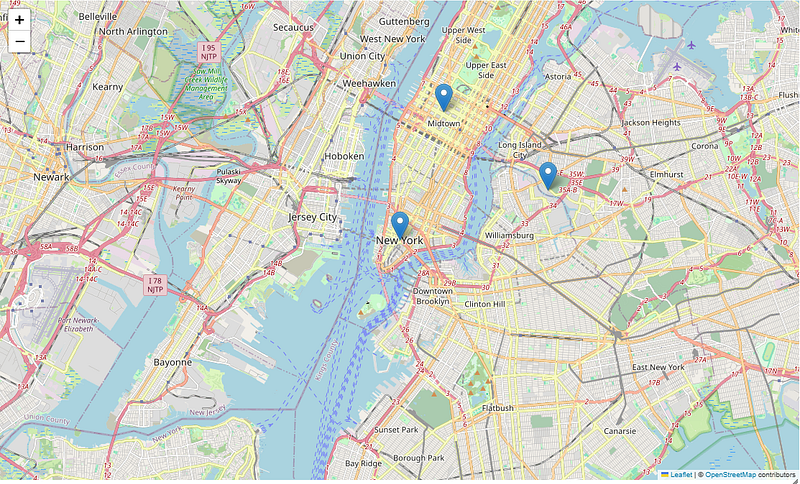
🔹 Step 3: Add Markers for Locations
Let’s add some store locations to our interactive map:
# Add store locations with popup labels
folium.Marker([40.730610, -73.935242], popup="Store A").add_to(m)
folium.Marker([40.758896, -73.985130], popup="Store B").add_to(m)
folium.Marker([40.712776, -74.005974], popup="Store C").add_to(m)

# Show the map
m
✅ Output: Clicking on markers displays store details!
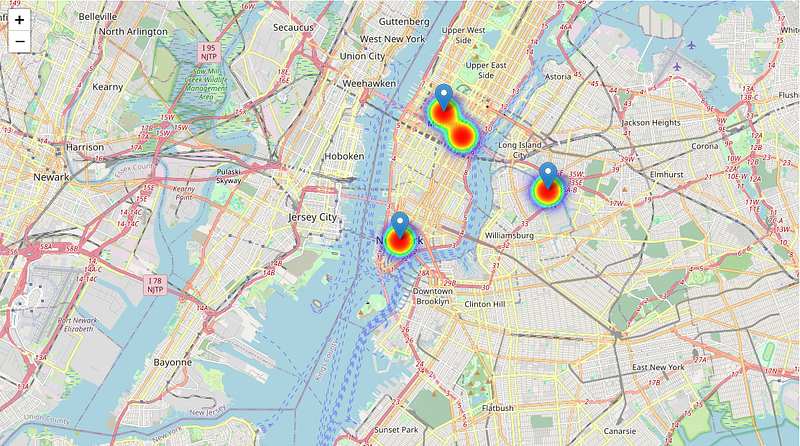
🔹 Step 4: Add a Heatmap (Optional)
If you have customer location data, you can visualize density using a heatmap.
First, install the Heatmap plugin:
pip install branca
Then, modify your Python script:
from folium.plugins import HeatMap

# Sample customer locations (latitude, longitude)
customer_data = [
    [40.730610, -73.935242],
    [40.758896, -73.985130],
    [40.712776, -74.005974],
    [40.750500, -73.976250]
]

# Add heatmap layer
HeatMap(customer_data).add_to(m)

# Show the map
m
✅ Output: A heatmap showing customer density in different areas.
4️⃣ How to Deploy & Share Your Interactive Map
Once you’ve created your HTML map, you can:
✅ Embed it in a website (perfect for businesses).
✅ Share the file with team members for data insights.
✅ Host it on GitHub Pages or a personal server.
💡 Example: A tourism website embeds an interactive map of attractions to help visitors explore a city.
5️⃣ Common Mistakes to Avoid in Interactive Mapping
❌ Not choosing the right map projection — Can lead to distorted views.
❌ Adding too much data at once — Can slow down performance.
❌ Forgetting to test across devices — Make sure it works on mobile & desktop.
❌ Ignoring user experience (UX) — Keep maps clean and simple.
💡 Example: A poorly designed map with too many layers can confuse users instead of helping them.
Conclusion: Why You Should Use Interactive Maps
✅ Engage users with clickable locations & filters.
✅ Improve decision-making with heatmaps & data layers.
✅ Easily share maps without GIS software.
🔗 Useful Resources & Links
- 🗺 Folium Documentation
- 📊 Plotly Map Visualizations
- 🎥 Interactive GIS Maps with Python (Video Guide)
Originally published on Medium.